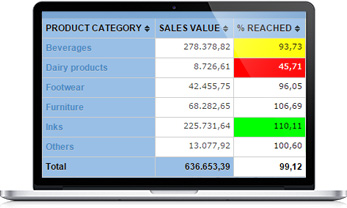
Analytics is a tool that allows the user to manage the business information through web interface and make its analysis through features,like ranking
pivoting, ABC Curves, vertical analysis, color conditions, filters, drill down etc. that facilitate their understanding.
Analytics’ Benefits
- Remote access to information of the company;
- Data can be viewed in chart, ABC Curve or grid format;
- Features to quickly and easily drill down and filter the data
- Color conditions for measures with the value above or below configured limits;
- Same visualization on PCs and tablets
The cubes available for Dashboards and Reports can also be used by Analytics.
Process Flow diagram


¹ Extracting, transforming and loading. SQL scripts may be coded by a developer or generated by BXBquery.
² Multidimensional database.
Analytics’ Features
- Shows the data in form of grid and ABC Curve
- The data can be viewed in summarized way and also detailed (through the drill down feature) down to the most detailed level
- Allows to apply color conditions on the measures
- Offers features for ranking and vertical analysis
- Offers many ways to filter the data
- Exports the data to many formats
- Allow to group the views by favorites and user groups
- Each user can see its individual list of views, favorite views or groups on which it belongs to


 55 41 3373 0790 / 99997 0235
