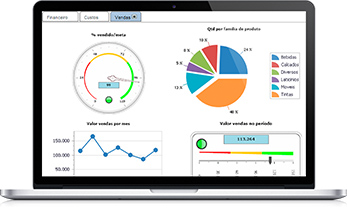
Business Intelligence software for easier viewing of the performance indicators of the organization, department or project.
Speedometers, thermometers and charts can show the performance of the business.
Dashboards
- Allows you to display the information in the form of a panel (dashboard), for a better understanding of the analyzed scenario;
- Facility to see the key performance indicators (KPIs);
- Web interface to be used in tablets;
- Ability to simultaneously display multiple KPIs
“Dashboards allows us to analyze our entire product line, as well as monitor our sales team quickly and easily. This gives us greater flexibility and safety in the decision making process.”
Tiago Pianaro, Sales Administration coordinator at Famiglia Zanlorenzi
Process flow diagram


¹ Extracting, transforming and loading. SQL scripts may be coded by a developer or generated by BXBquery.
² Multidimensional database.
Dashboard’s features
- Allows you to configure dashboards with charts and gauges (speedometer and thermometers)
- Each user can view its own panel
- The panel can automatically be updated from time to time
- The panels can be exported to PDF and PNG and also be sent via e-mail


 55 41 3373 0790 / 99997 0235
